01 User Story & Pain Points
User Story: The Scenario
The Onboarding Bottleneck
50 Servers, 500 Manual Interactions.
A Cloud Operations Lead is tasked with scaling a new branch office, needing to enable Azure Monitor and Defender on 50 newly deployed servers to meet corporate compliance standards.
Without a centralized management tool, the lead is forced to navigate into each machine individually to configure extensions. What should be a single “Apply Policy” action transforms into days of repetitive manual labor, creating a severe bottleneck for the migration project.
“Right now I have to do it one by one. It's impossible to keep up.”
Pain Points: The Friction
Manual Repetition
Enabling a standard set of services on just 100 machines requires hundreds of discrete clicks. This lack of bulk actions leads to operational fatigue and slows down fleet expansion.
Disjointed Discovery
Value-added services are buried in deep menus or scattered across different portals. Users often fail to discover available security tools, directly impacting service adoption rates.
Inconsistent Compliance
Manual configuration breeds human error. Without a “Define Once” template, machines inevitably drift from the baseline, leaving hidden security gaps across the fleet.
Define Success: The Metrics
Shift from hours (manual entry) to minutes (bulk action) for a 50-server fleet deployment.
Drive usage-based revenue by increasing the percentage of machines with Monitor/Defender enabled.
Eliminate configuration drift by adopting “Define Once” reusable templates.
02 Research & Strategy
The Structural Gap
Our audit revealed that while high-level management services existed, the 'bridge' connecting them to individual Arc resources was missing.
Translating user insights into a scalable architecture.
Users were overwhelmed navigating disparate portals for Monitor, Defender, and Policy.
Build a "Centralized Management Layer" that aggregates all signals.
80% of users managed fleets, yet interactions were designed for single machines.
Shift interaction model to "Manage Scope," enabling bulk actions.
Technical constraints buried value-added services deep in navigation.
Surface "Service Health" directly on dashboard to drive adoption.
03 Ideation & Trade-offs
Configuration Strategy
The Conflict: We needed to balance workflow efficiency (keeping users in the list) with financial transparency (showing costs clearly). While side-panels work for quick edits, enabling paid services across a fleet carries a billing risk that requires absolute clarity.
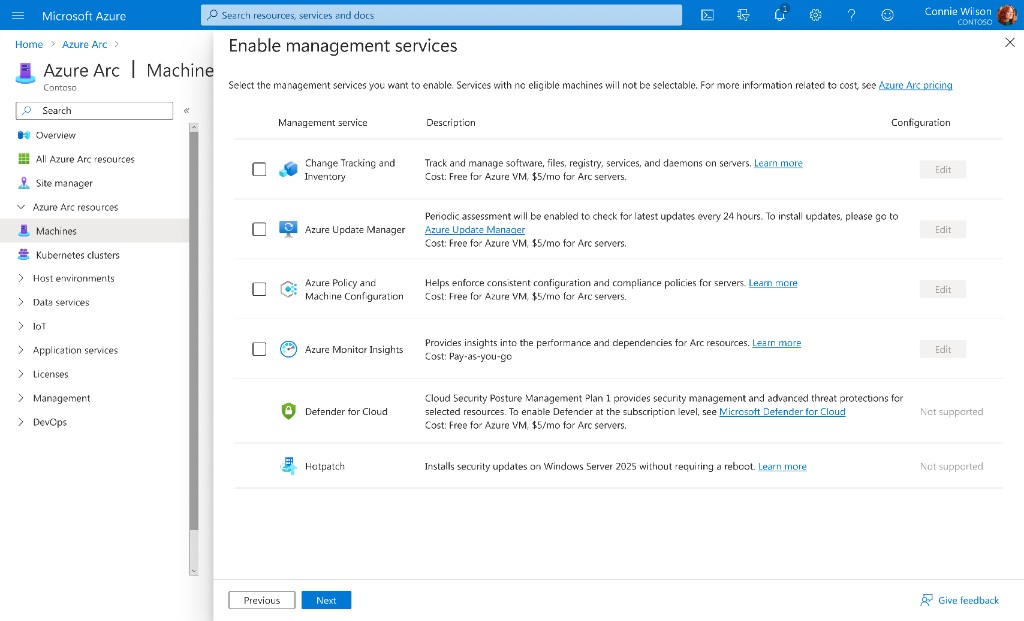
Option A: The Contextual Blade
A slide-out panel that allows users to configure services without leaving the resource inventory list. The goal was to minimize context switching and keep users "in the flow."
Pros: Keeps users in their primary context; reduces navigation friction and maintains the mental model of "editing a list."
Cons: The limited horizontal width forced critical columns—specifically Cost Estimates and Eligibility—off-screen. Hiding billing information behind a horizontal scrollbar introduced an unacceptable risk of accidental overspending.
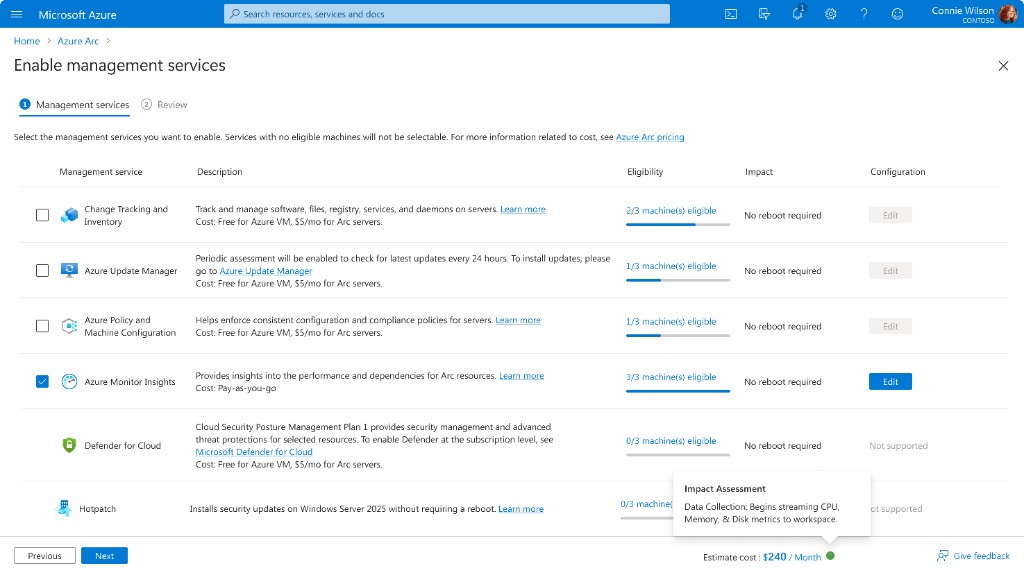
Option B: The Dedicated Wizard
A full-screen, immersive workflow that isolates the configuration task from the inventory view, prioritizing maximum screen real estate for complex data tables.
Pros: The wide layout accommodates side-by-side verification of "Eligibility" and "Monthly Costs" for every machine. This empowers SREs to make budget-conscious decisions with zero anxiety before committing.
Cons: Higher interaction cost; temporarily removes the user from their inventory context (Tradeoff accepted for safety).
The Verdict
We chose Option B (The Dedicated Wizard). While it introduces a temporary context switch, we mitigated the friction by embedding Real-time Cost Estimation directly into the flow. This ensures Admins have all the necessary decision-making data (Price & Eligibility) within the wizard, eliminating the need to cross-reference the previous list.
Dependency Resolution Strategy
The Conflict: Cloud resources often have strict pre-requisites (like Data Collection Rules). We had to decide: do we force users to prepare these before entering the wizard (clean architecture), or allow them to create them during the wizard (messy architecture but better UX)?
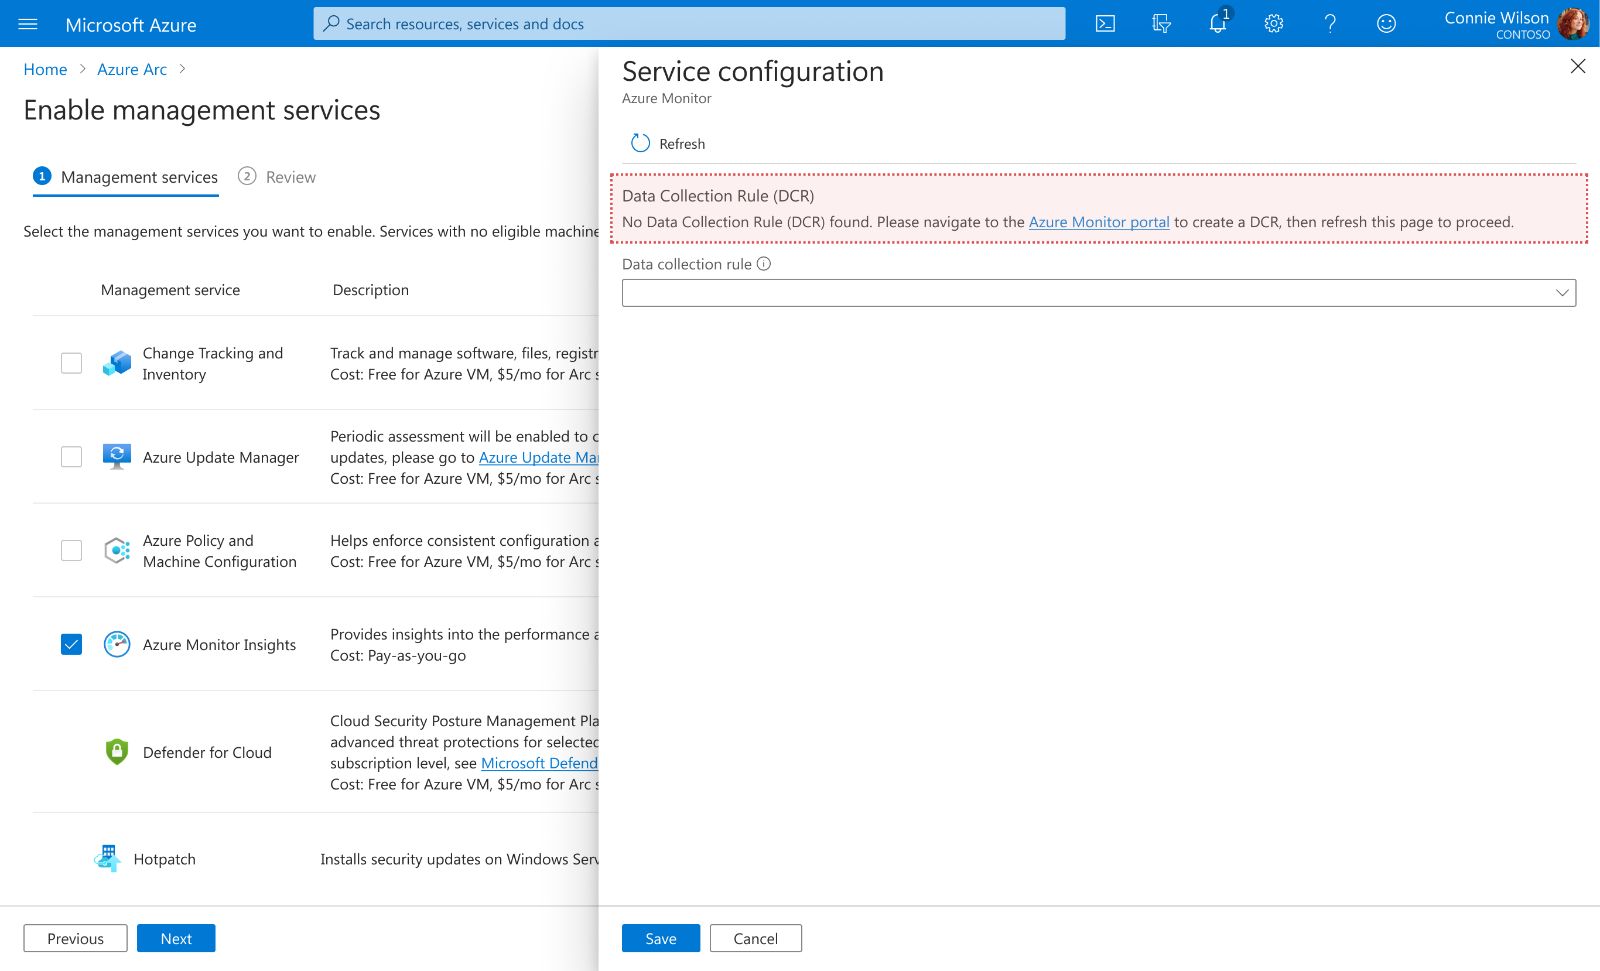
Option A: Decoupled Validation (Strict)
The wizard treats the Data Collection Rule (DCR) as a strict external dependency. If missing, the flow is blocked.
Pros: Maintains architectural purity; ensures "Separation of Concerns" between configuration and provisioning.
Cons: "As visualized by the error state, missing dependencies create a Hard Blocker. Forcing users to abandon the wizard, navigate to a different portal, and refresh the page resulted in a 40% workflow abandonment rate.
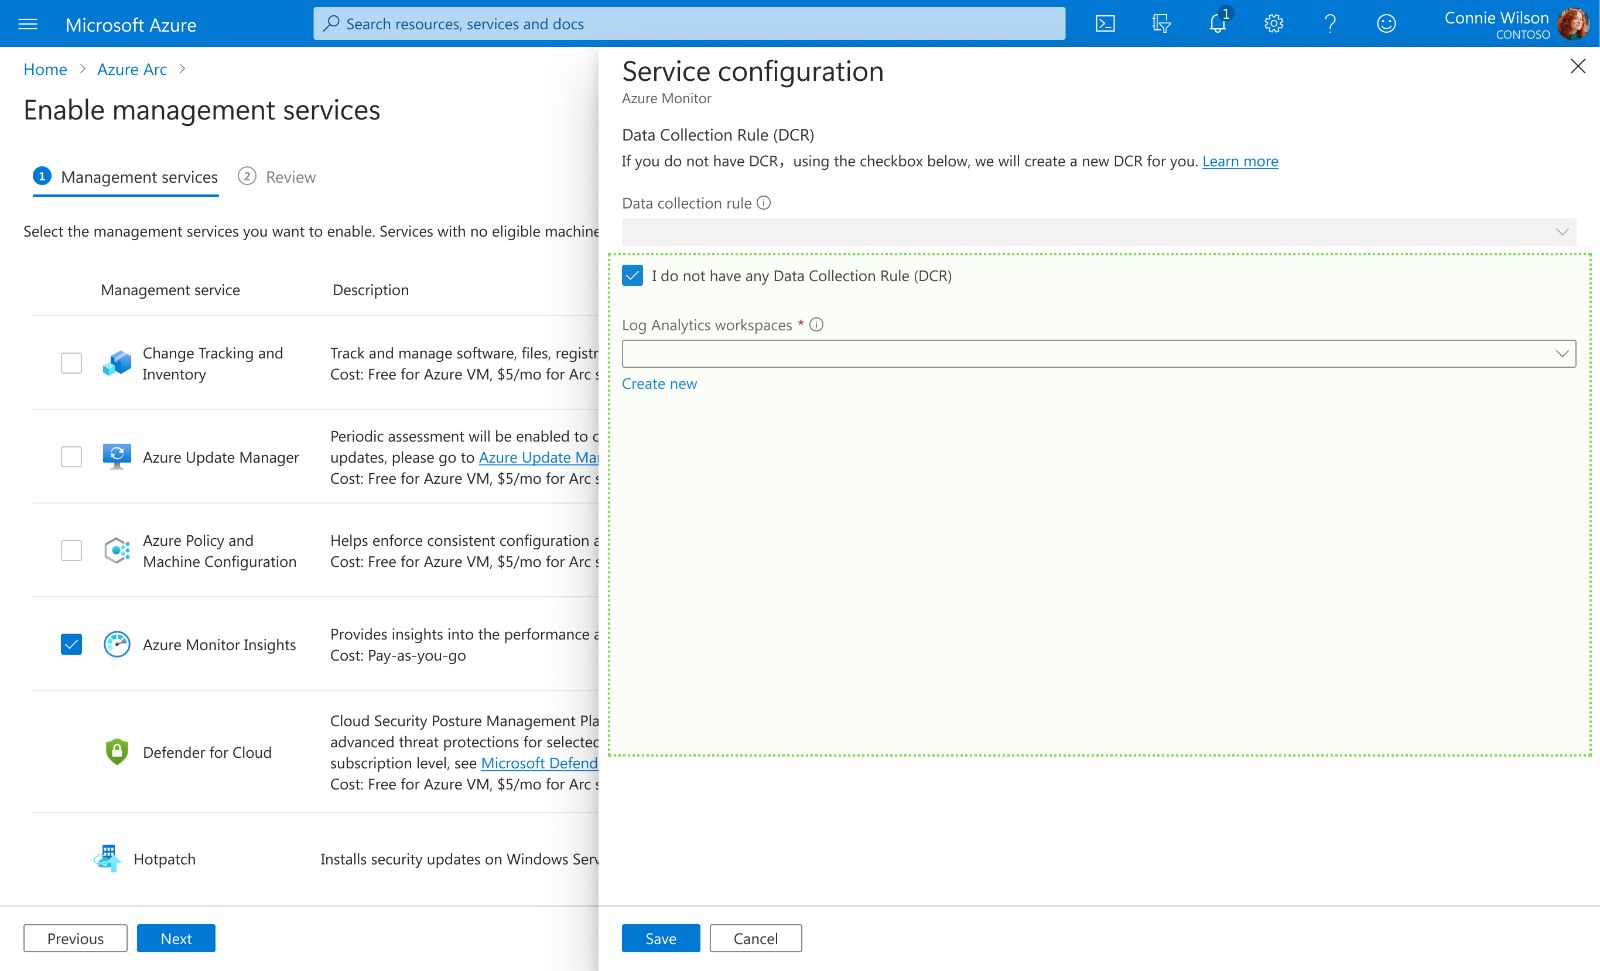
Option B: Nested Provisioning (Inline)
We embed a "micro-provisioning" flow directly within the configuration drawer, allowing users to create dependencies on the fly.
Pros: We prioritized Velocity over simplicity. By allowing "Just-in-Time" resource creation, users can resolve infrastructure gaps synchronously without exiting the wizard. The backend handles the complex async state management invisibly.
Cons: Significantly higher engineering effort to handle nested states and error recovery within a modal.
The Verdict
We chose Option B (Nested Provisioning). We accepted the trade-off of higher engineering complexity (managing asynchronous states) to eliminate the #1 cause of workflow abandonment. By removing the "context-switching tax," we ensured that strict technical prerequisites never become operational blockers.
04 The Solution
The final design transforms disjointed, single-server tasks into a unified "Fleet Orchestration" workflow. Use the interactive viewer below to explore how we streamlined the journey from discovery to deployment.
Process Flow Diagram
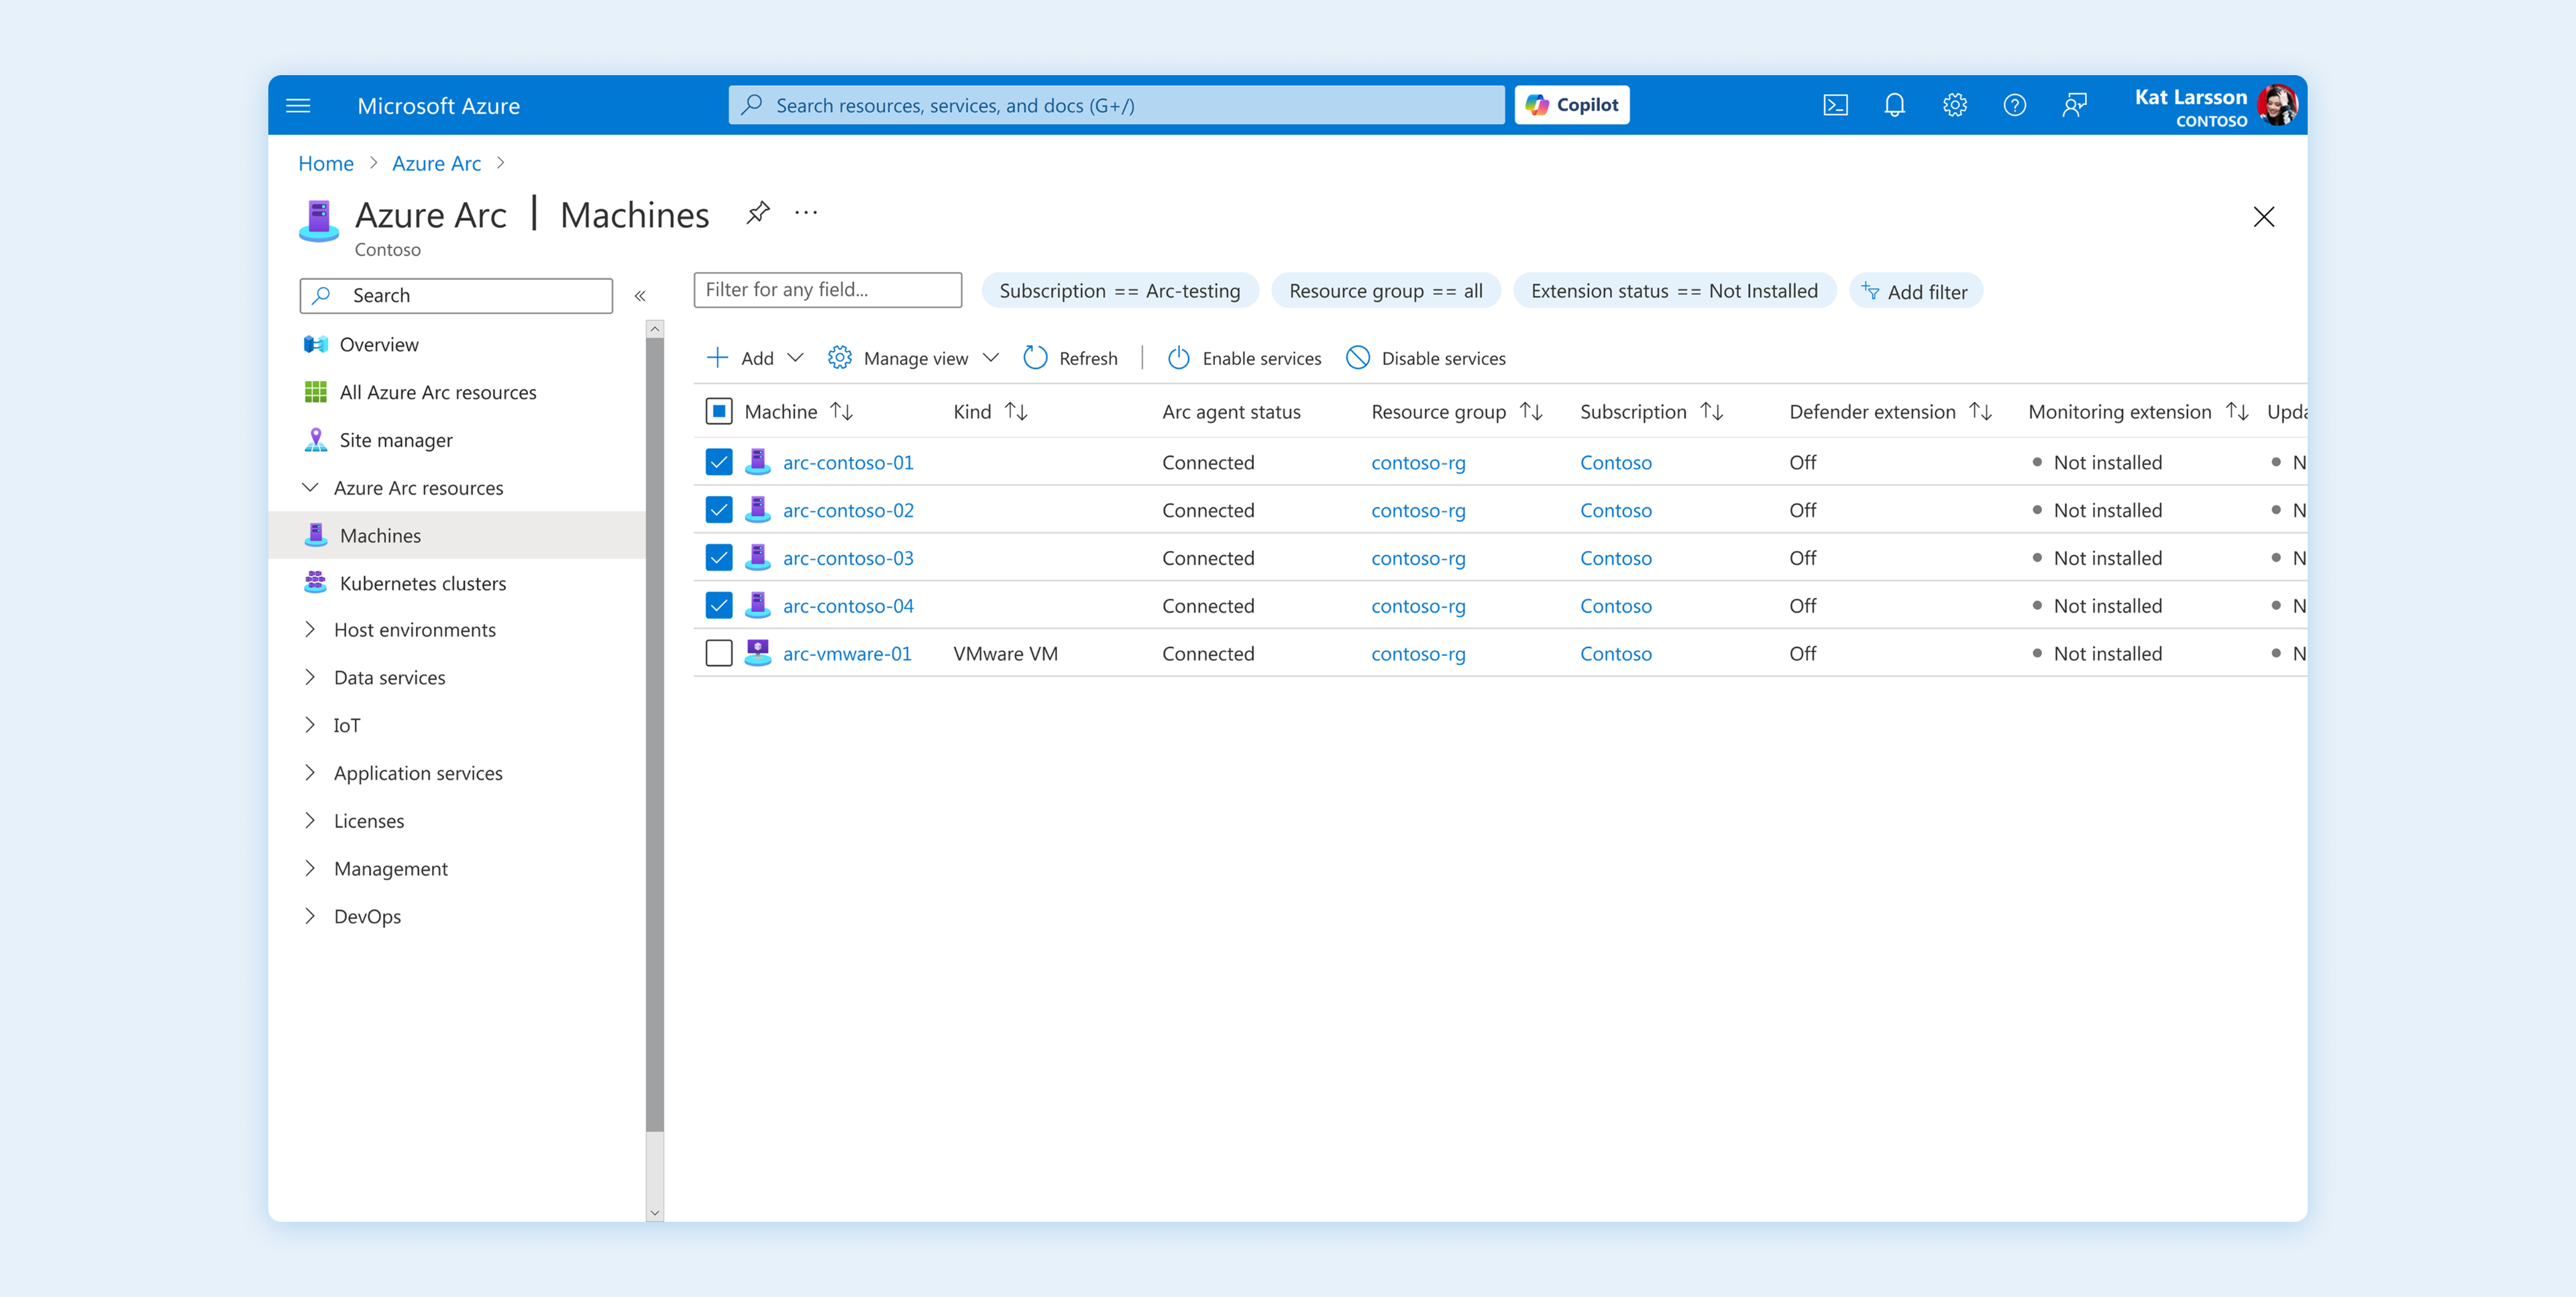
Query-Based Scoping
Replaced manual, row-by-row hunting with dynamic property filters. Administrators can now utilize specific queries (e.g., Status == Not Installed) to instantly isolate non-compliant resources from a fleet of thousands.
Visual Evidence & Action
High-contrast status indicators (e.g., "Off", "Not installed") provide immediate cognitive confirmation of the scope. The workflow trigger is embedded directly within this context, bridging the gap between discovery and remediation.
05 Impact & Key Learnings
The Impact
Trust Reduces Anxiety
Pricing transparency is just a data point.
Pricing transparency builds trust.
In B2B, "Adoption" is about removing the fear of the unknown. When we explicitly show costs and risks upfront, we replace decision anxiety with operational confidence.
Scale Requires Unification
Managing 50 servers is 50x the work.
Admin time is finite and valuable.
Designing for scale means respecting the user's time. By unifying disjointed tools into a single view, we returned time and agency to the human behind the screen.
Flow Preservation is Critical
Dependencies must be resolved.
Interruptions break focus.
The biggest drop-off happened when we forced users to leave the flow. Moving resolution inline taught me that a resilient system handles complexity for the user.
"Complexity is inevitable in the cloud, but confusion is optional. Design is the bridge between the two."